Visualizing Race/Ethnic
Groups in Oklahoma Corrections
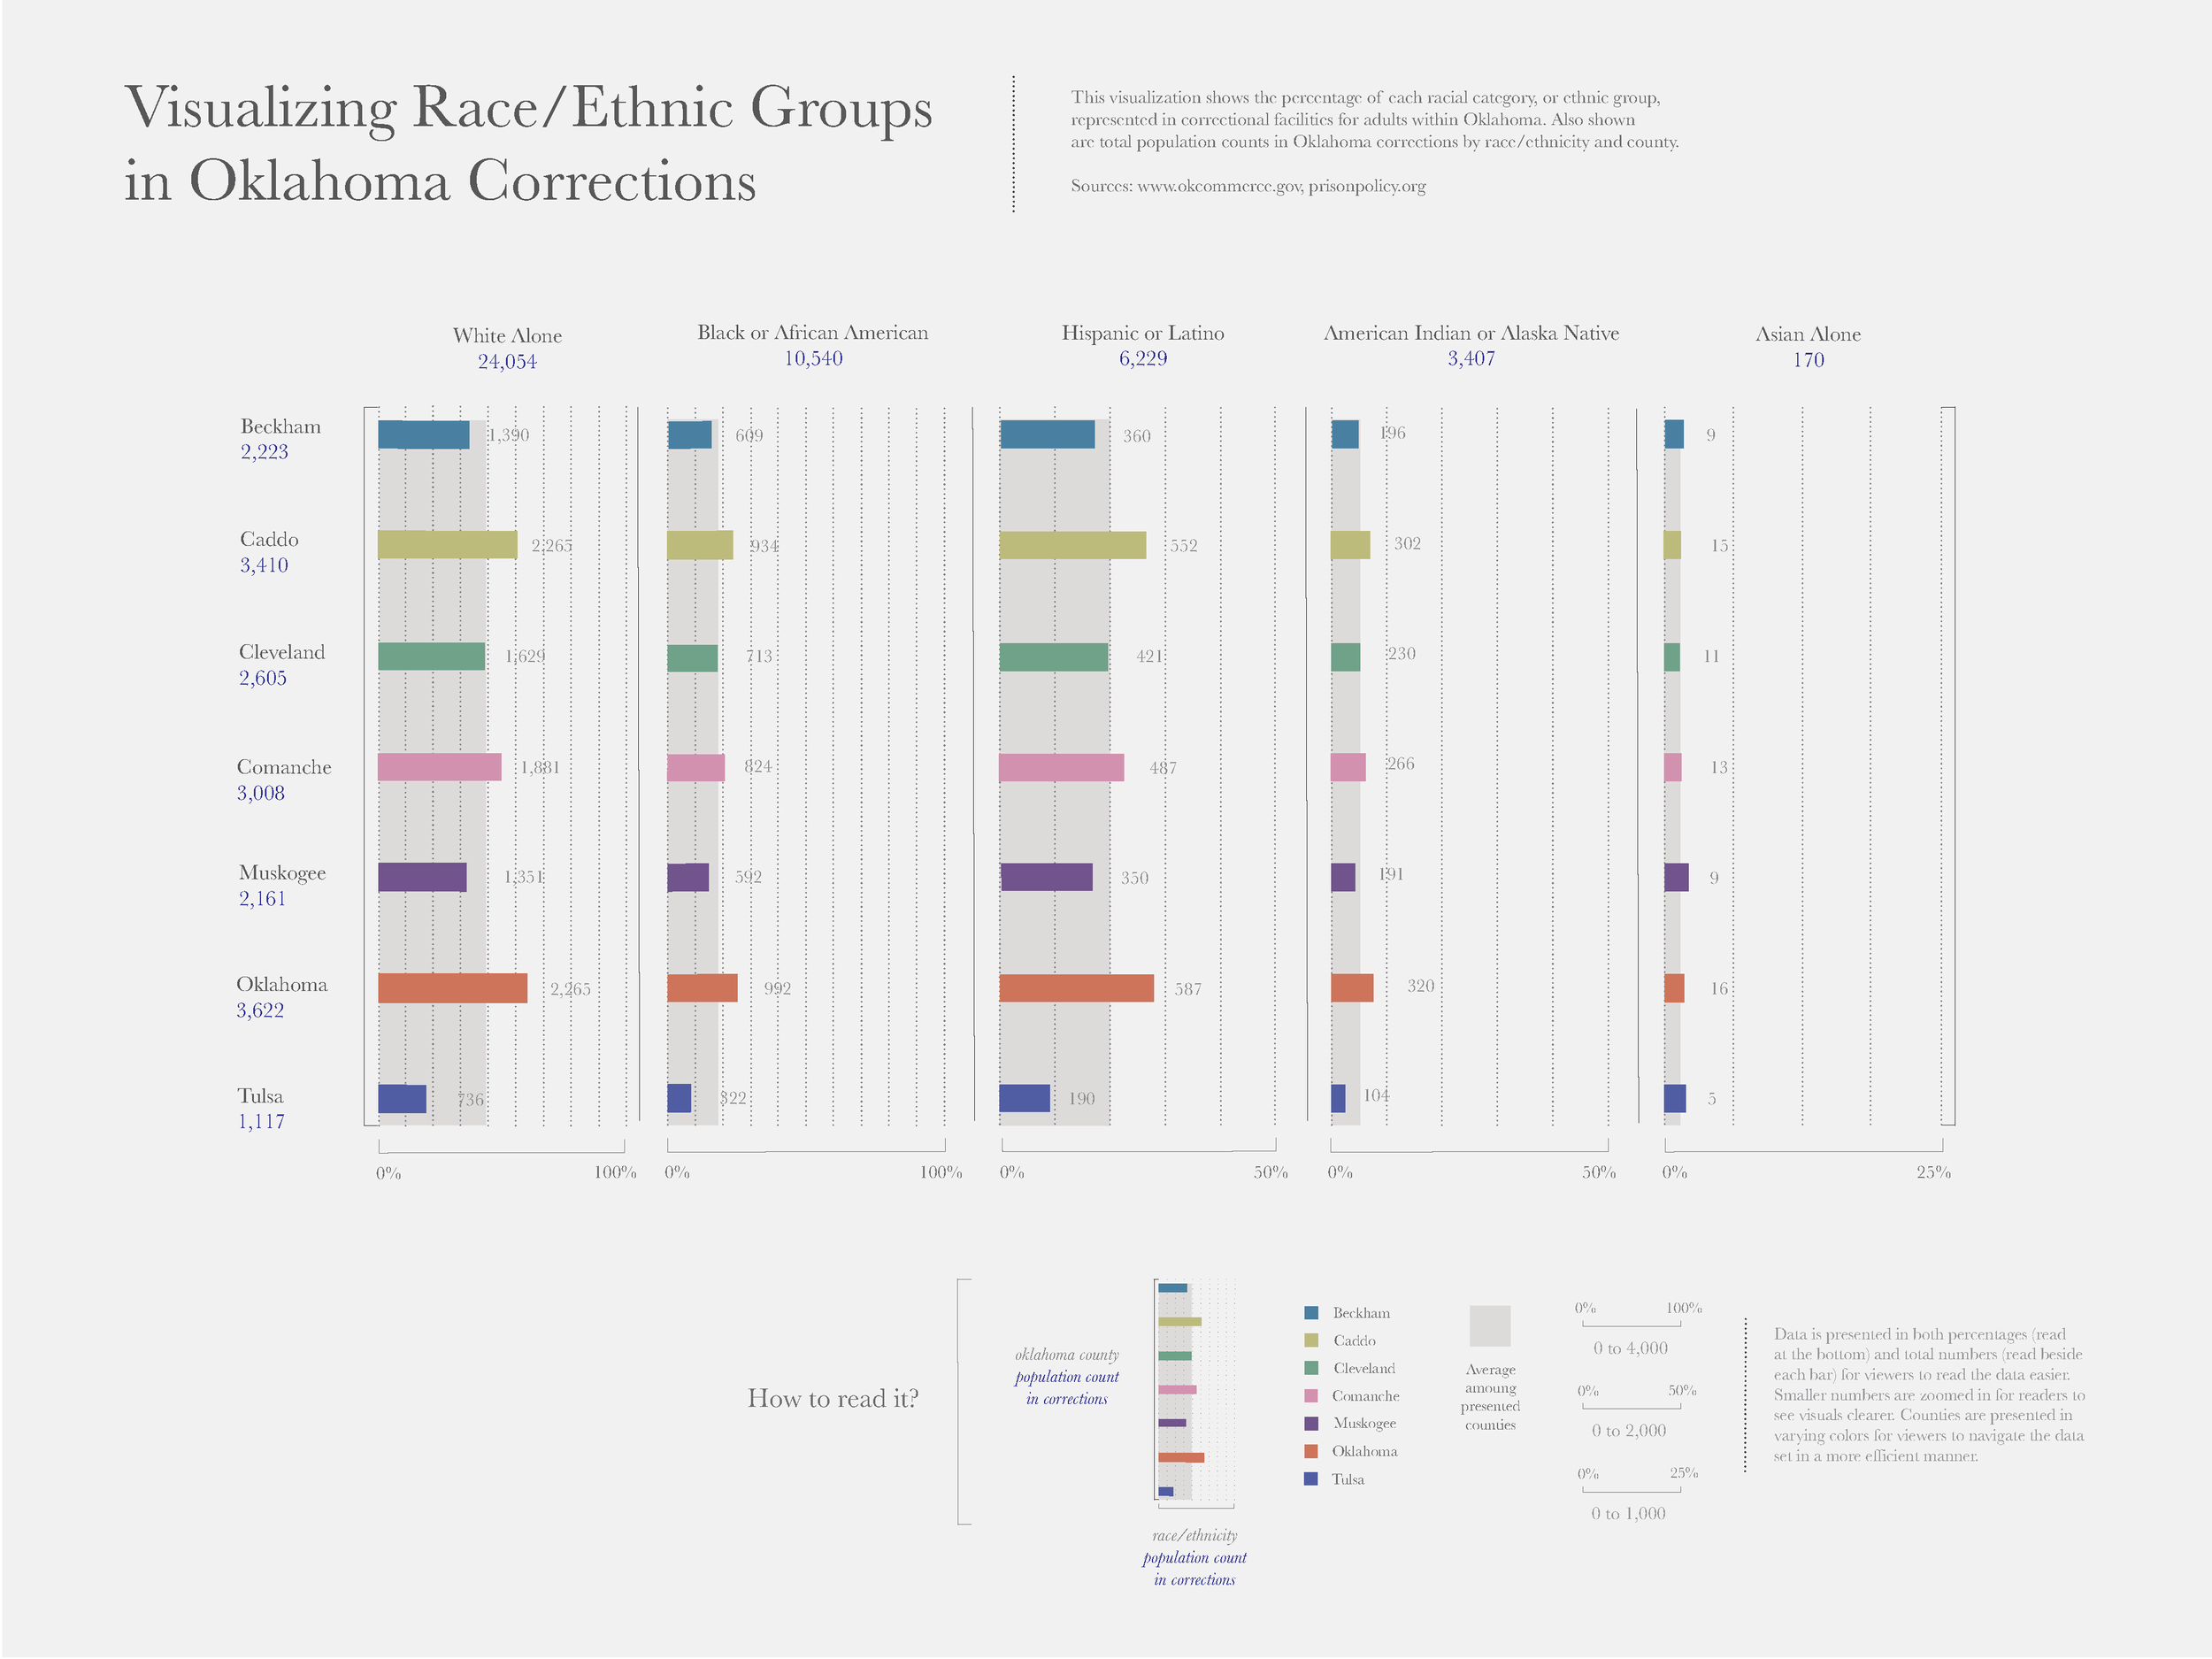
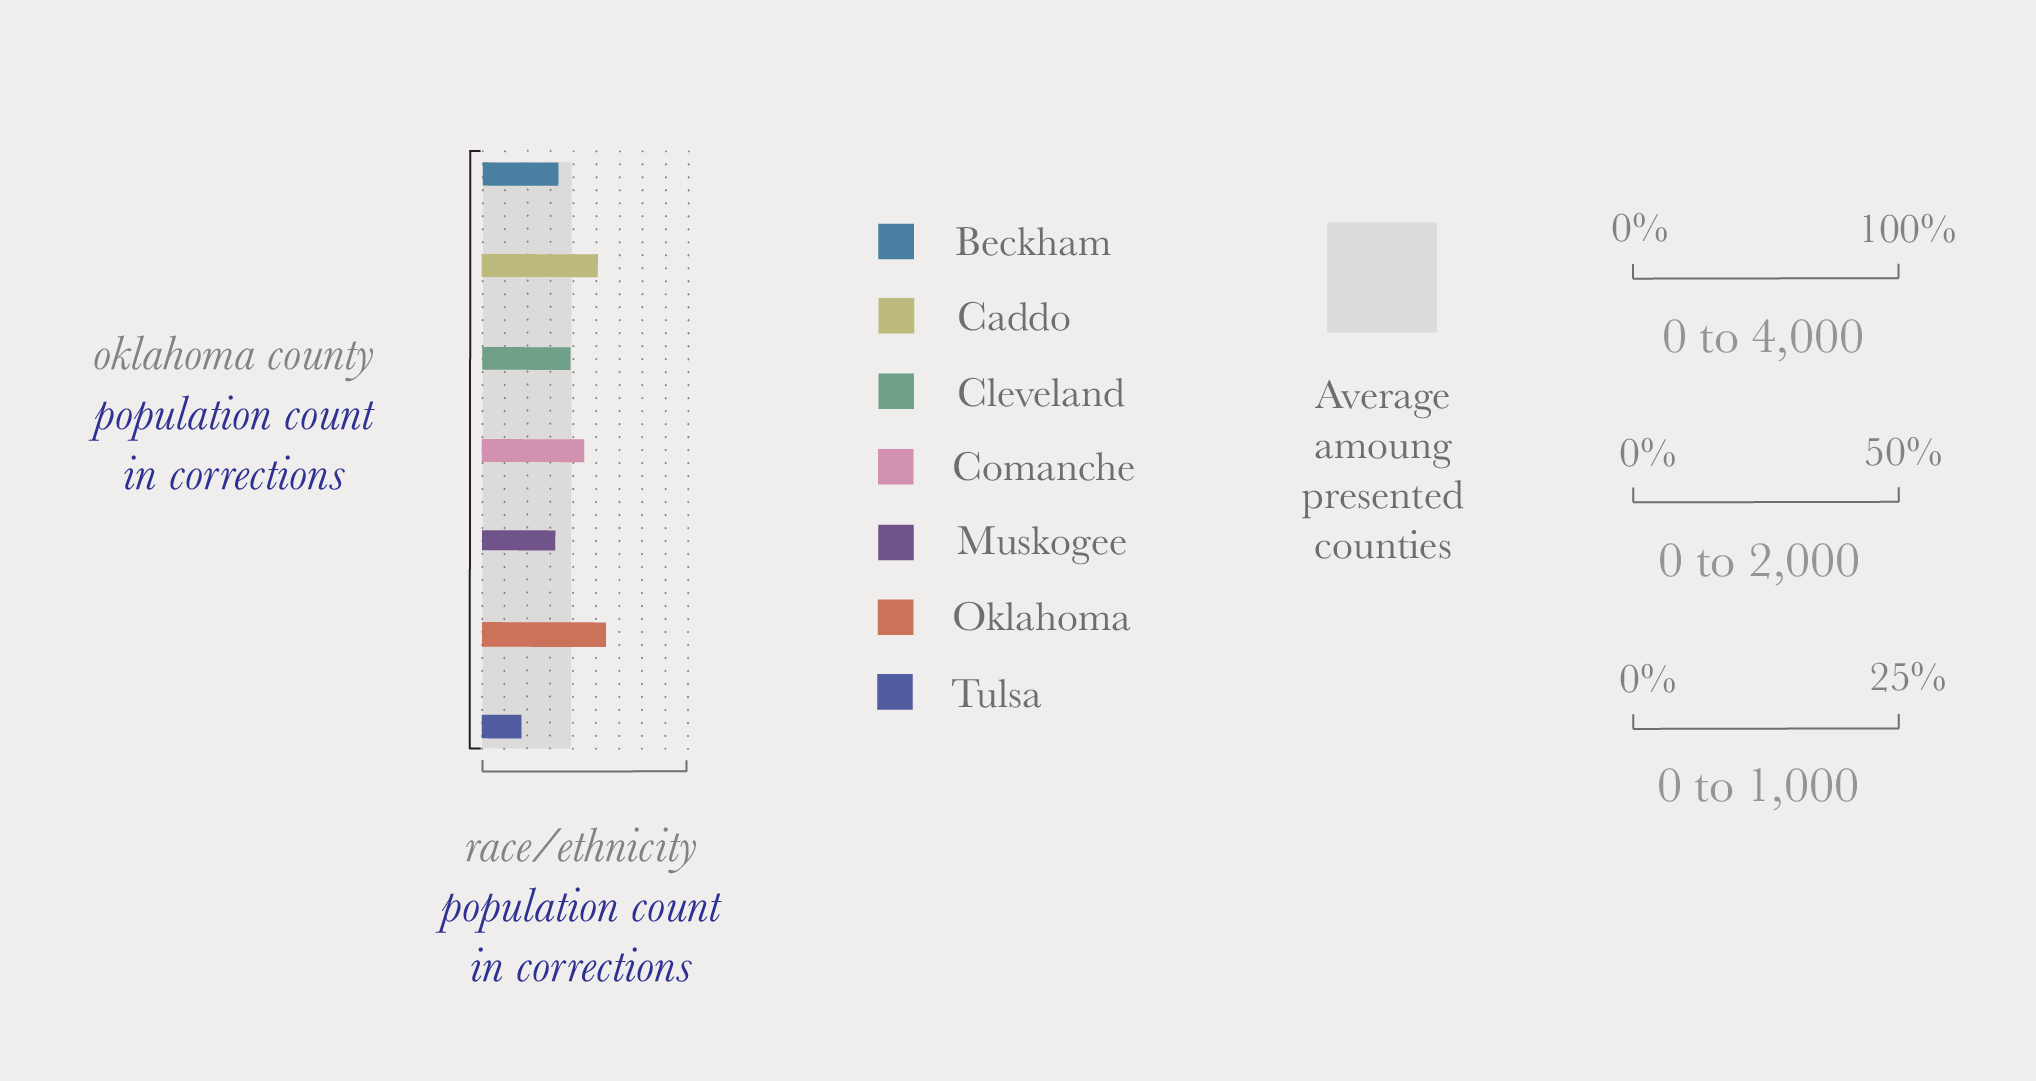
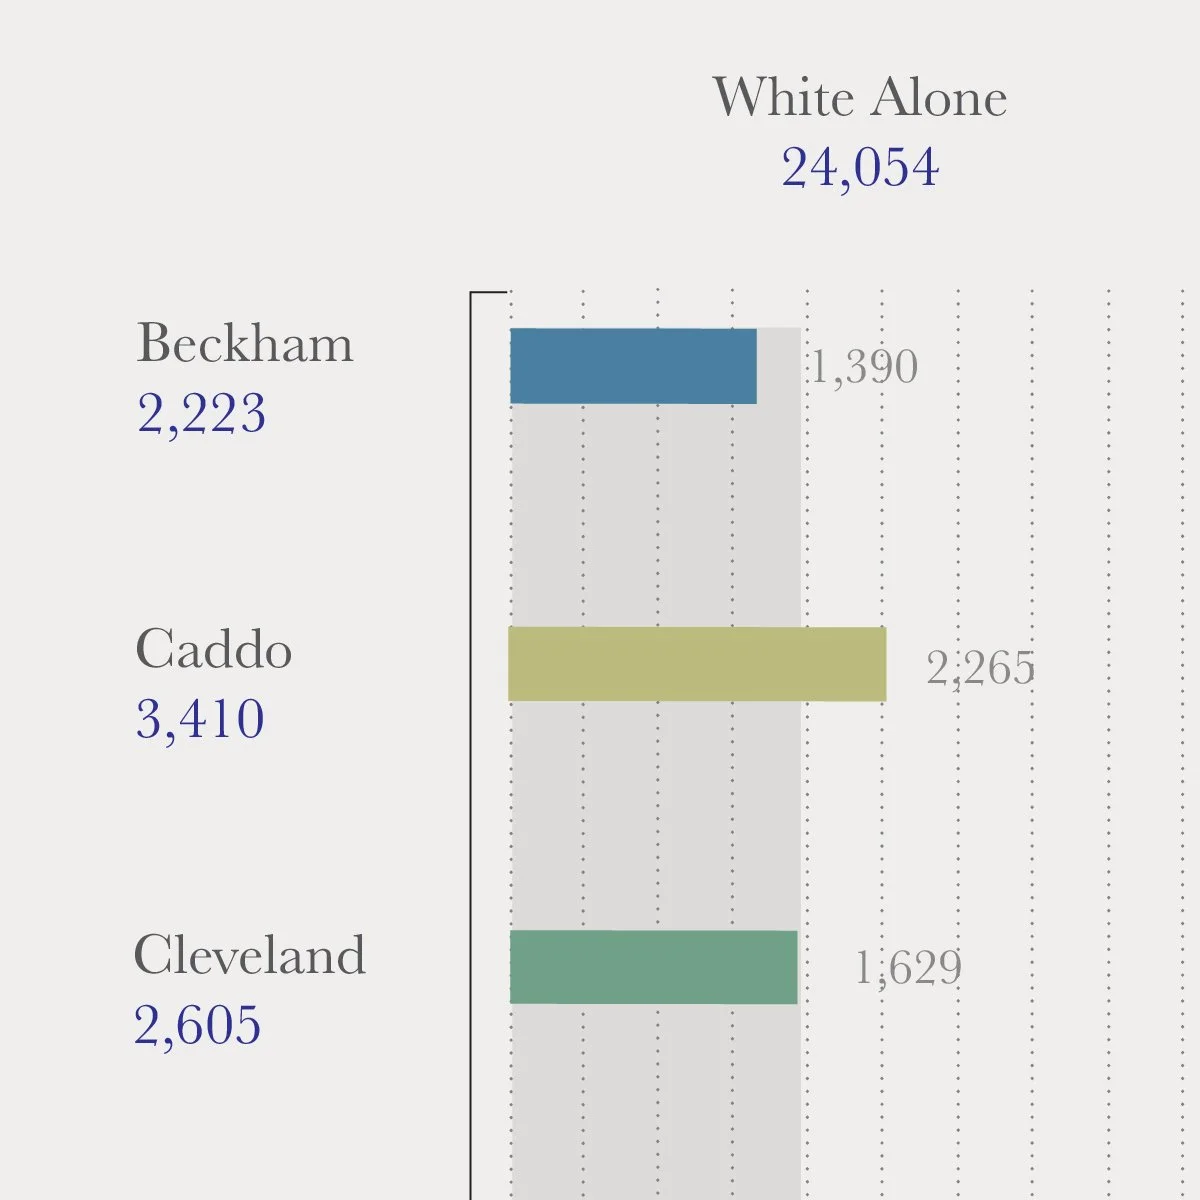
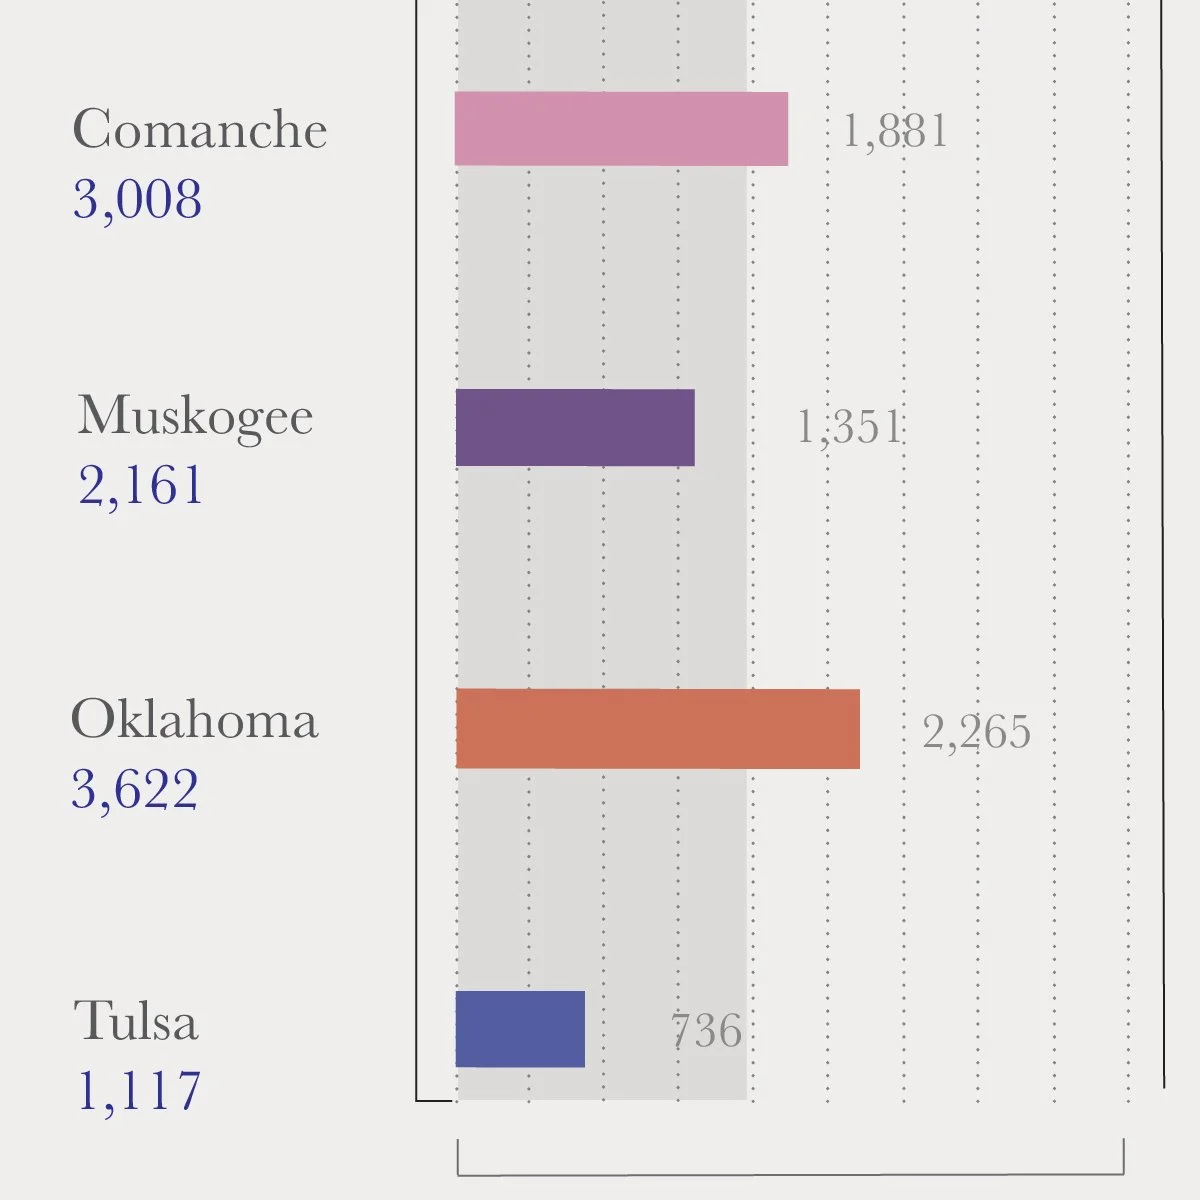
Project Description: This project was completed as part of a university design course where students were tasked with creating a data visualization on a research topic of their choosing. This data visualization reveals the percentages of each racial category, or ethnic group, within Oklahoma correctional facilities for adults. Using research and a number of calculations to locate estimate totals for each racial category and ethnic group, this form of visual data represents information in a clear and direct manner.
Sources: www.okcommerce.gov, prison policy.org
Tools Used: Illustrator, Excel
Date: Fall Semester, 2022
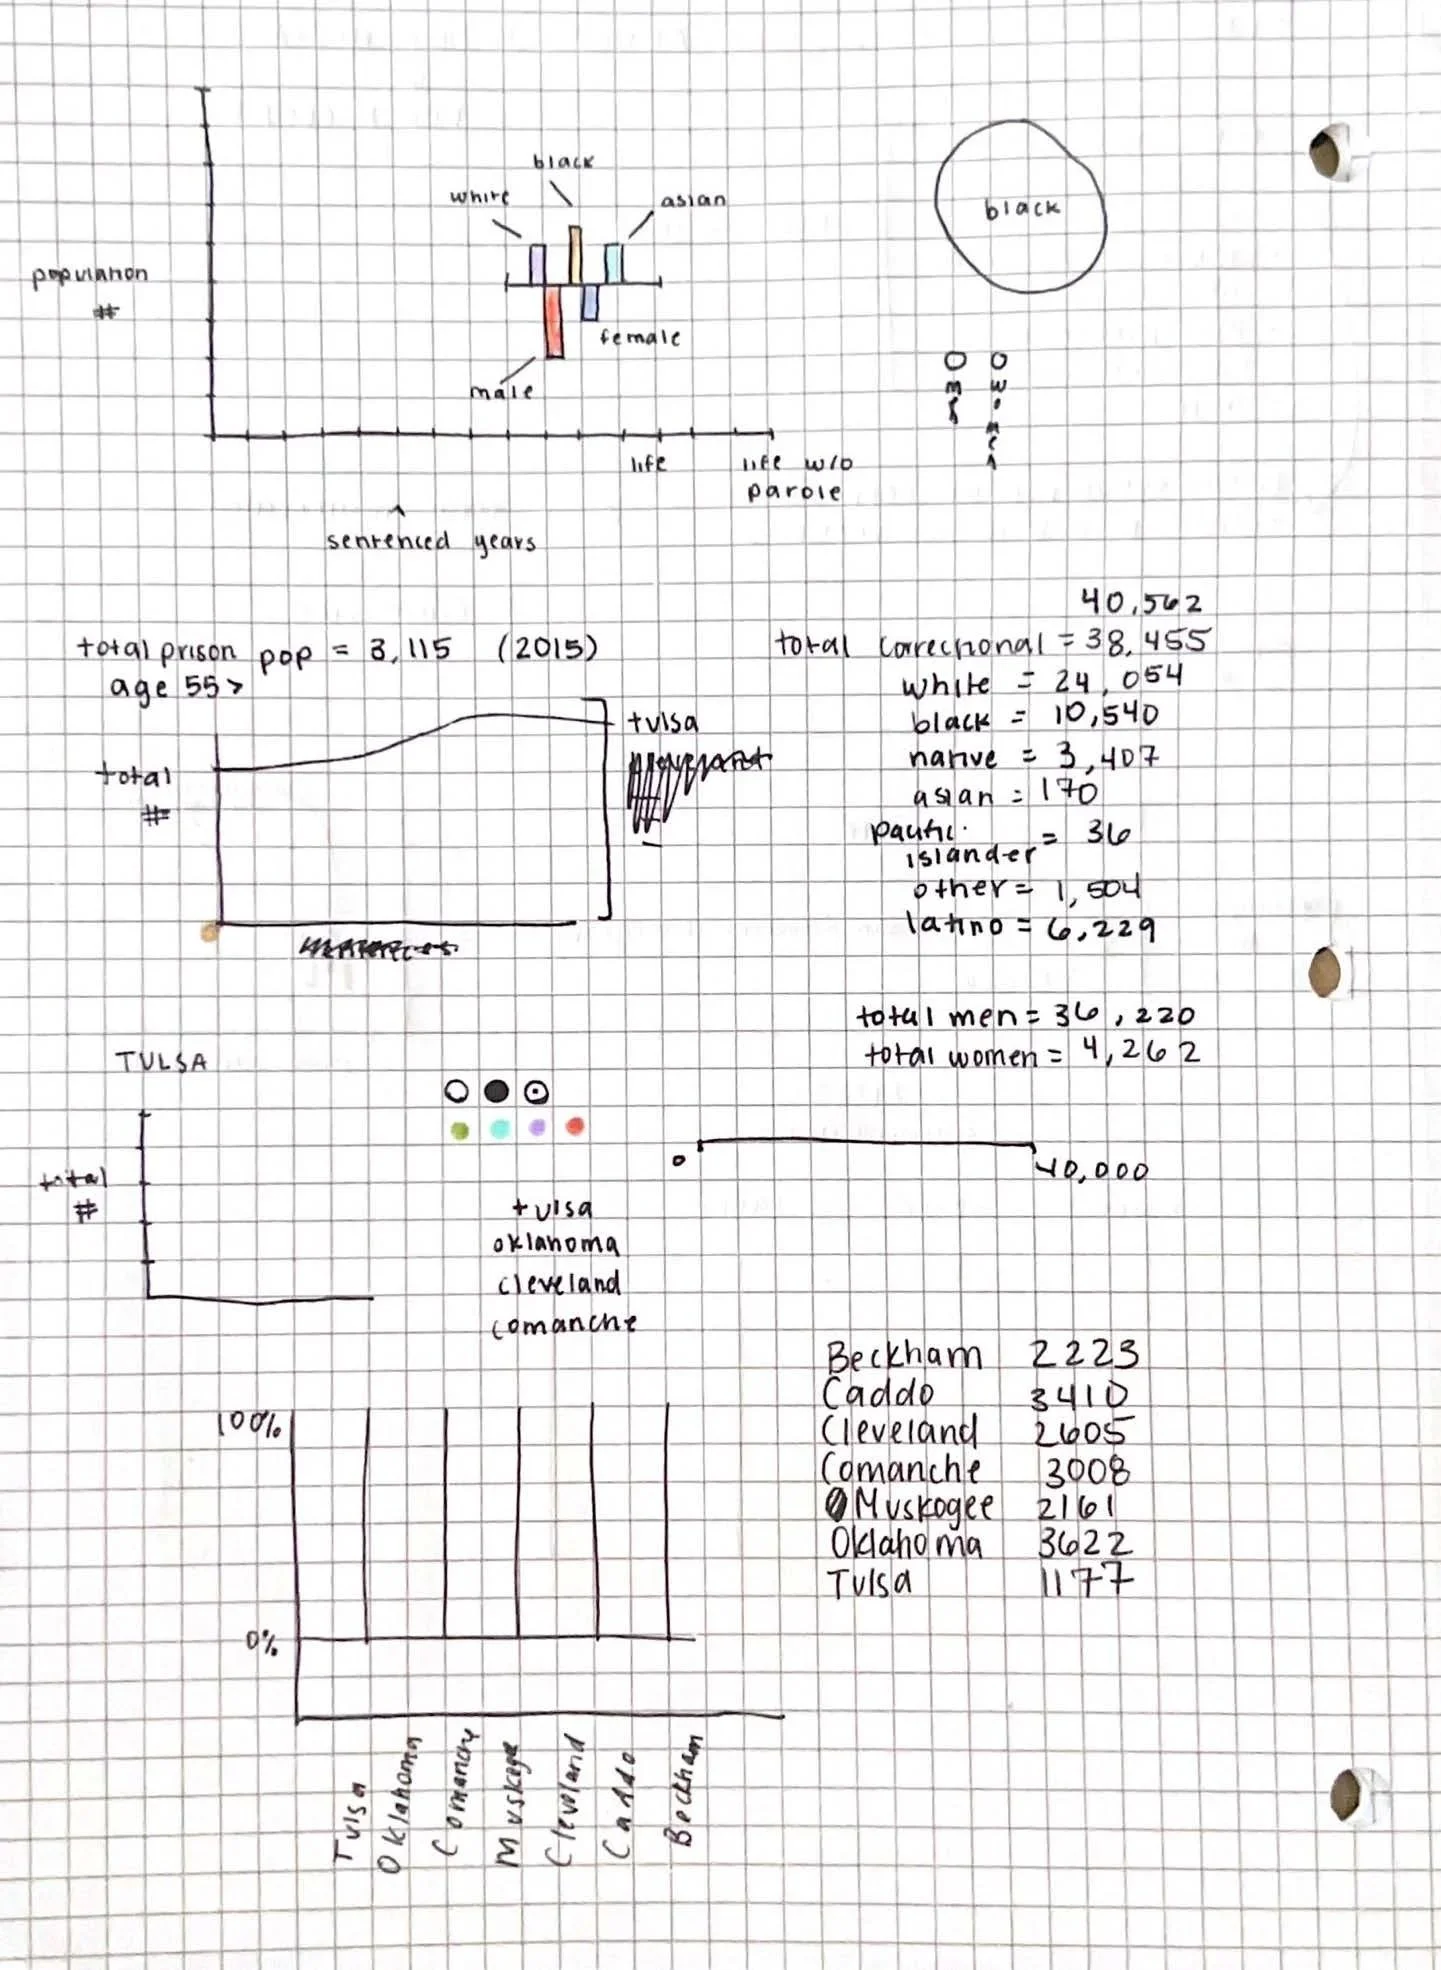
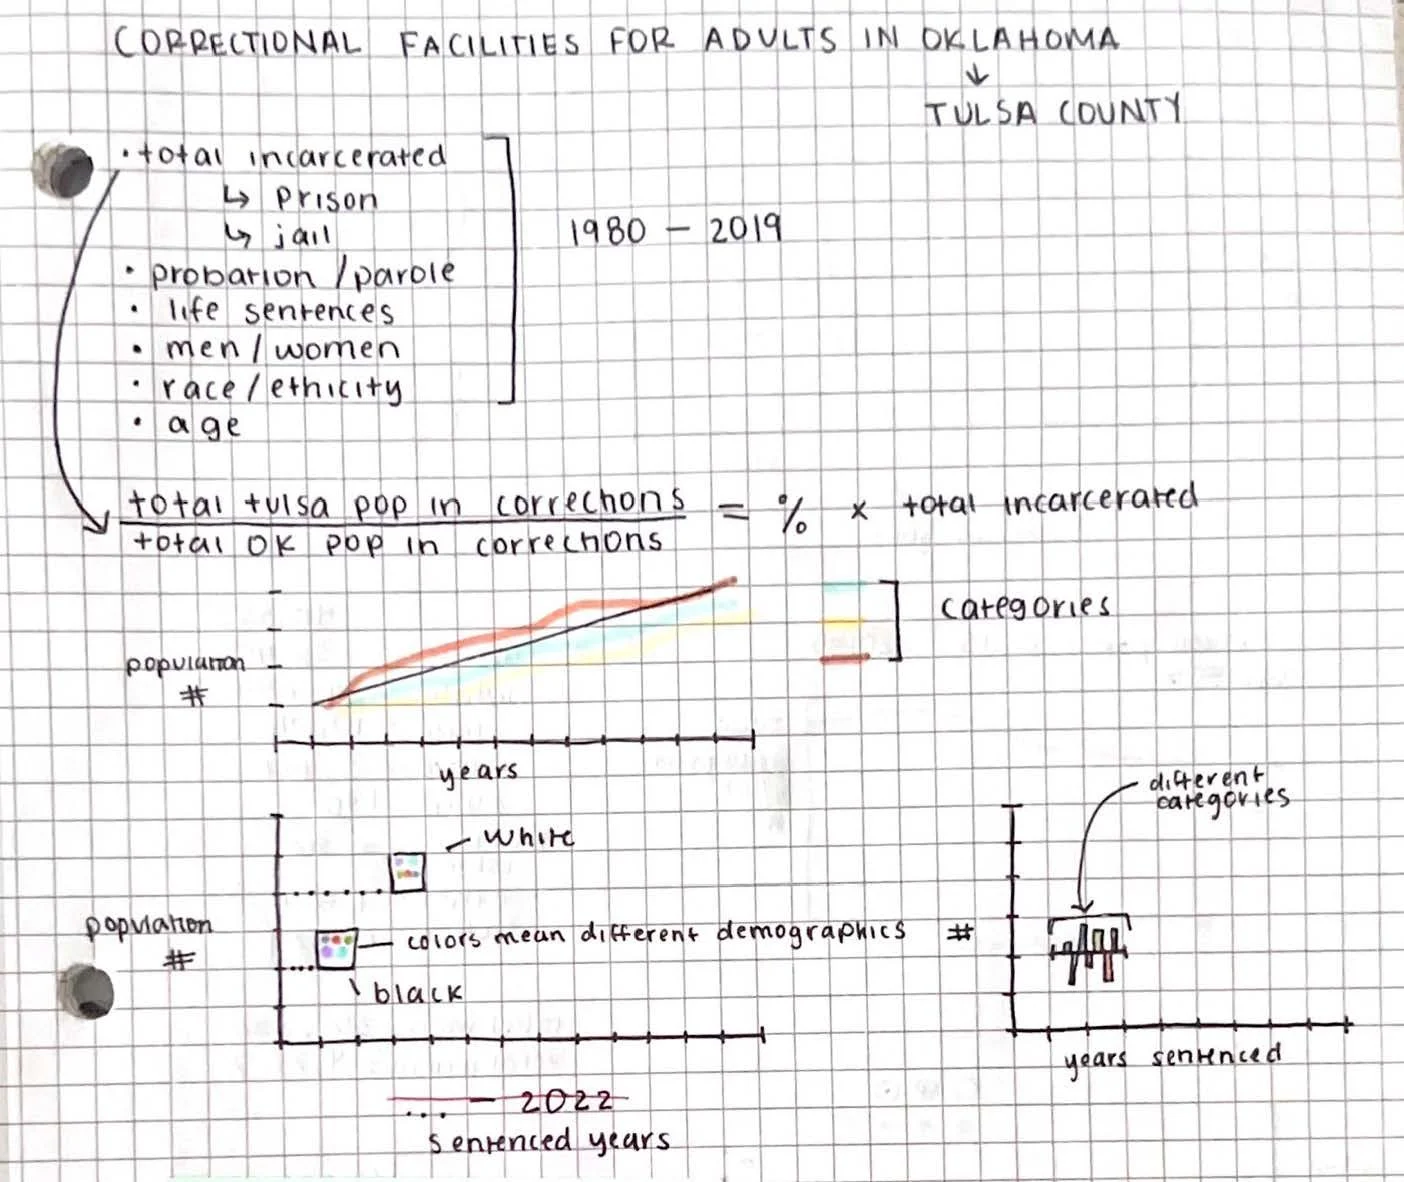
Preliminary research and sketches.